Drivers whose photocard licence or entitlement to drive expires between February 1 and December 31, 2020 have been extended for 11 months from the date of expiry under temporary changes announced by the Driver and Vehicle Licensing Agency (DVLA).
The initial extension expired at the end of August and has been further extended to the end of the year.
Under the changes, drivers whose photocard driving licence or entitlement to drive runs out between 1 February 2020 and 31 December 2020 will have their entitlement automatically extended from the expiry date, for a period of 11 months.
Drivers do not need to apply to renew their licence until they receive a reminder before their extension expires, says the DVLA.
Julie Lennard, chief executive of the Driver and Vehicle Licensing Agency, said: “Being able to drive is a lifeline for millions of people and this further extension will ensure that in these continued uncertain times, drivers don’t need to worry about the admin or the associated costs with renewing their licences.
“The temporary extension is automatic, and drivers do not need to do anything. Drivers who have already applied to renew their photocard driving licence or entitlement to drive can usually carry on driving while we process their application providing, they have not been told by their doctor or optician that they should not drive.”
The Government granted a seven-month extension to drivers whose photocard driving licence expired between the start of February and the end of August. By Graham Hill thanks to Fleet News
Share My Blogs With Others:These icons link to social bookmarking sites where readers can share and discover new web pages.
The Government has launched a consultation to decide how it will stop vehicles from blocking pavements.
It outlines three options: improving the traffic regulation order process to make it easier for councils to prohibit pavement parking in their areas, giving councils powers to fine drivers who park on paths, and a London-style nationwide ban on pavement parking.
Transport Secretary Grant Shapps announced the plans in March. The proposals are designed to improve the lives of people with mobility or sight impairments, as well as parents with prams who may be forced into the road to get around parked cars.
Shapps said: “Parking on pavements means wheelchair users, visually impaired people and parents with push chairs can be forced into the road, which is not only dangerous, but discourages people from making journeys.
“A key part of our green, post-Covid recovery will be encouraging more people to choose active travel, such as walking, so it is vital that we make the nation’s pavements accessible for everyone.”
Recent research from the charity Guide Dogs shows that 32% of people with vision impairments and 48% of wheelchair users were less willing to go out on their own because of pavement parking, decreasing independence and contributing towards isolation.
In 2019 the Department for Transport concluded a review which looked at the problems caused by pavement parking, the effectiveness of legislation, and the case for reform.
It found that pavement parking was problematic for 95% of respondents who are visually impaired and 98% of wheelchair users.
The Transport Select Committee also recently conducted an inquiry into the issue, with the commitment to consult on proposals forming a key part of the Government’s response to its findings.
RAC head of roads policy Nicholas Lyes said: “Blocking pavements impacts most on those with disabilities and those pushing buggies and creates unnecessary danger for pedestrians. In short, nobody should be forced into stepping into the road to get around a vehicle that has taken up pavement space, so the Government is right to explore giving local authorities additional powers to enforce this types of selfish parking.
“However, outlawing pavement parking as a whole is more complex because not all streets in the UK are the same. For example, some drivers will put a tyre up the kerb on a narrow residential street to avoid restricting road access to other vehicles while still allowing plenty of space for pedestrian access. Therefore better guidance and a definition of what is and isn’t appropriate would be a more practical solution, rather than an outright ban.”
The Range Rover Sport continues to be the most stolen vehicle in the UK, according to the latest data from Tracker.
Land Rover models have dominated Tracker’s top 10 most stolen and recovered models over the past five years with the Range Rover Sport consistently appearing in the top five.
The data also revealed an increase in the number of cars stolen without the keys. Between January and July, 96% of cars recovered by Tracker were stolen without the keys, compared to 92% during the same period last year.
Clive Wain, head of Police Liaison for Tracker, said: “Keyless car thefts are continuing to rise at an alarming rate, as criminal groups reverse-engineer the latest manufacturer security tech to steal valuable vehicles quickly and discreetly.
“It took just 80 seconds to steal a £120,000 bespoke Range Rover that was fitted with one of our tracking devices from a supermarket carpark in Walthamstow, London. It was broad daylight, and not one person noticed what the thieves were doing.
“The car was recovered within 24 hours and it appeared that the thieves had searched for tracking devices before leaving the vehicle parked unoccupied to see if the police would track its whereabouts. Because the Tracker device was professionally installed, the thieves were unable to find it, leaving the police to quickly track its location.”
The most recent Home Office figures reveal that vehicle theft has rocketed by 50% over the last five years, with experts saying many cars are being stolen using keyless technology. The Government claims that 56,000 vehicles are stolen in the UK each year, though experts say the true figure could be more like 100,000.
Wain added: “Stealing cars is a very lucrative business which is why there is a significant amount of organised criminal activity in this market. These gangs steal to order for four broad reasons: for export, often to Eastern Europe, for their identity to be changed and the vehicle sold on within the UK; for parts, which is a growing problem and where the vehicle is stripped down in a so-called ‘chop shop’; and to be used in further crimes.”
Tracker data reveals the top targets for vehicle thefts in 2019 have remained firm targets for thieves in 2020, despite many vehicles being parked at home during lockdown. This demonstrates location is not a barrier to determined criminals.
Most popular cars stolen and recovered by Tracker in 2020:
1. Range Rover Sport
2. BMW X5
3. = Range Rover Vogue and Land Rover Discovery
4. Range Rover Autobiography
5. Mercedes-Benz C Class
By Graham Hill thanks to Fleet News
Share My Blogs With Others:These icons link to social bookmarking sites where readers can share and discover new web pages.
Covid-19’s impact on the economy is not denting interest in electric vehicles (EVs), with record-breaking registrations in Europe in July.
New analysis by Jato Dynamics shows that electric registrations, including hybrid and fully electric cars, were up 131% year-on-year to 230,700 – the first time it’s exceeded 200,00 units.
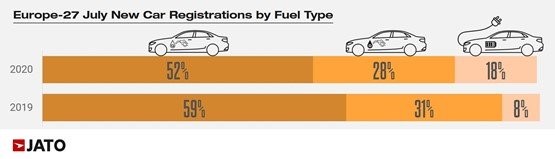
As a consequence, EVs accounted for 18% of total registrations in July, far greater than their market share of 7.5% in July 2019, and 5.7% in July 2018.
Felipe Munoz, global analyst at Jato Dynamics, said: “The rise in demand for EVs is strongly related to a wider offer that is finally including more affordable choices. The higher competition amongst brands is also pushing down prices.”
Half of the electric cars registered were powered by a hybrid engine (HEV), with demand soaring by 89%, with the mild hybrid versions of the Ford Puma and Fiat 500 contributing to this result.
Plug-in hybrid EVs (PHEVs) followed with 55,800 units, up by 365% from July 2019, helped by new models like the Ford-Kuga, Mercedes A class, BMW XC40 and BMW 3-Series.
Registrations for zero-emission battery EVs (BEVs) increased from 23,400 units in July 2019 to 53,200 a year later, and the offer increased from 28 different models available to 38.
New models like the Peugeot 209, Mini Electric, MG ZS, Porsche Taycan and Skoda Citigo helped drive demand.
TESLA DECLINE
However, Tesla posted a 76% decline to 1,050 units following shipping delays to Europe, as a consequence of production challenges in its Fremont, California plant.
Munoz said: “In contrast to the general trend of increasing demand for electric cars, Tesla is losing ground this year in Europe. Some of this can be explain by issues relating to the production continuity in California, but also by high competition from brands that play as locals in Europe.”
EUROPEAN CAR REGISTRATIONS
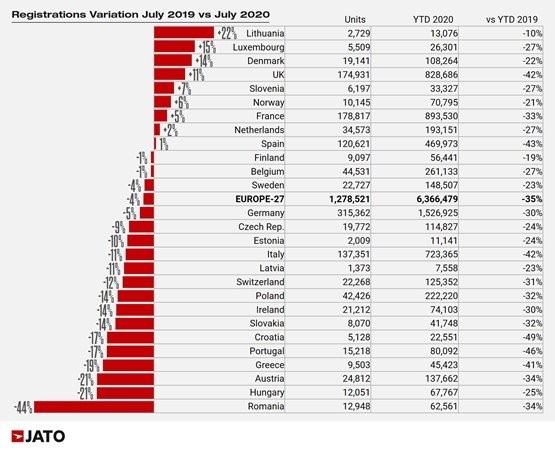
Jato’s data for 27 markets shows July saw the highest monthly volume figures so far this year – this also being the highest since September last year – with the industry registering 1,278,521 new passenger cars, down by only 4% month on month from 2019.
Munoz explained: “Both private and business consumers are responding to the better market conditions. If the current situation continues to improve, we could start to talk about a ‘V’ shaped recovery in the European car industry.
“However, there are still huge uncertainties regarding how and when the pandemic will finally come to an end, therefore caution remains.”
Volume levels since January fell by 35% to 6.37 million cars. However, demand recorded healthy figures in countries such as the UK, Denmark and France, alongside other small and midsize markets.
Much of this boost can be explained by an increased appetite for green cars, and more value offers, according to Jato.
Munoz continued: “The increasing demand predominantly favours SUVs, with a wider offering, including more electrified versions.”
SUV GROWTH
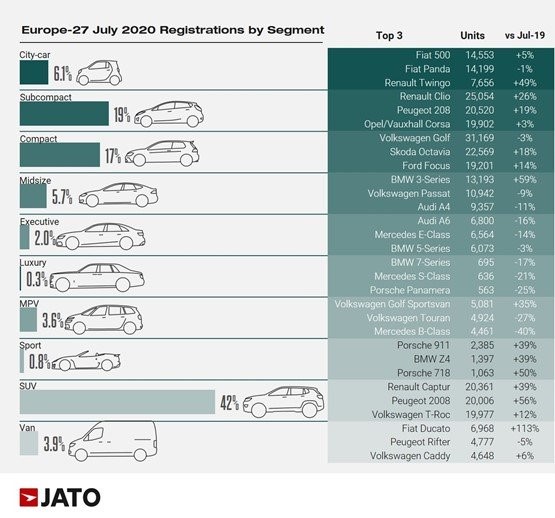
Last month, SUVs accounted for almost 42% of total registrations to 530,800 units, posting the highest monthly volume since July 2019.
“SUVs are usually more expensive than their car equivalents, so it is remarkable to see that despite the crisis, this is the only segment that has seen growth,” said Munoz. “They prove that with a competitive offer, consumers respond positively, despite the difficulties.”
Midsize SUVs were the only segment to record a decrease of 6%, a contrast to the positive results seen from small (up 9%), compact (up 4%) and large/luxury SUVs (up 14%).
At the same time, their demand has grown fast due to the electrification of many of the models available. In July, 48% of the electrified vehicles registered were SUVs.
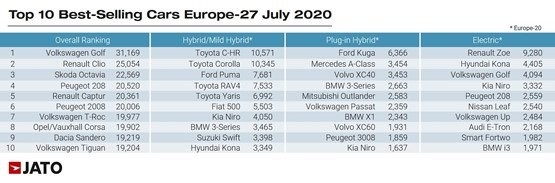
VW GOLF REGAINS FIRST PLACE
The greater availability of the eighth generation Volkswagen Golf helped it regain first place in the rankings, that was previously lost in June.
However, it was not enough to offset the large drop posted by the seventh generation, as the average variation was negative. In contrast, the Renault Clio was able to record a 26% increase, as 89% of its volume corresponded to the latest generation.
The Skoda Octavia, Peugeot 208, Renault Captur and Peugeot 2008 also posted double-digit growth thanks to their recently launched new generations.
Other big improvers include the Hyundai Kona (up 56%), BMW 3-Series (up 59%), Mini Hatch (up 26%), Volvo XC40 (up 66%), BMW X1 (up 49%) and BMW 1-Series (up 52%).
The Renault Zoe and Kia Niro increased their registrations by 146% and 111% respectively.
Among the latest launches: Ford Puma (13,157 units at 24th position); Skoda Kamiq (8,736 units); Mazda CX-30 (5,494); Kia Xceed (5,201); Audi Q3 Sportback (4,183); Mercedes GLB (2,469); and Porsche Taycan (1,498).
VW GOLF REGAINS FIRST PLACE
The greater availability of the eighth generation Volkswagen Golf helped it regain first place in the rankings, that was previously lost in June.
However, it was not enough to offset the large drop posted by the seventh generation, as the average variation was negative. In contrast, the Renault Clio was able to record a 26% increase, as 89% of its volume corresponded to the latest generation.
The Skoda Octavia, Peugeot 208, Renault Captur and Peugeot 2008 also posted double-digit growth thanks to their recently launched new generations.
Other big improvers include the Hyundai Kona (up 56%), BMW 3-Series (up 59%), Mini Hatch (up 26%), Volvo XC40 (up 66%), BMW X1 (up 49%) and BMW 1-Series (up 52%).
The Renault Zoe and Kia Niro increased their registrations by 146% and 111% respectively.
Among the latest launches: Ford Puma (13,157 units at 24th position); Skoda Kamiq (8,736 units); Mazda CX-30 (5,494); Kia Xceed (5,201); Audi Q3 Sportback (4,183); Mercedes GLB (2,469); and Porsche Taycan (1,498). By Graham Hill thanks to Fleet News
Share My Blogs With Others:These icons link to social bookmarking sites where readers can share and discover new web pages.
The Government has launched a consultation that could lead to the introduction of cars with Level 3 autonomous driving capabilities by next year.
The Call for Evidence will look at the Automated Lane Keeping System (ALKS) – an automated system which can control the steering, brakes and acceleration of the vehicle (currently at low speeds of up to 37mph), keeping it in lane.
This technology is designed to enable drivers – for the first time ever – to delegate the task of driving to the vehicle in certain situations, such as traffic jams.
Audi developed the technology for its A8 model, as ‘Traffic Jam Pilot’, and planned to introduce it once legislation allowed, but has since confirmed that it won’t be offered on the current model.
When activated, the system keeps the vehicle within its lane, controlling its movements for extended periods of time without the driver needing to do anything. The driver must be ready and able to resume driving control when prompted by the vehicle, however.
The Government is seeking views from industry on the role of the driver and proposed rules on the use of this system to pave the way towards introducing it safely in Great Britain, within the current legal framework.
The Call for Evidence will ask whether vehicles using this technology should be legally defined as an automated vehicle, which would mean the technology provider would be responsible for the safety of the vehicle when the system is engaged, rather than the driver.
It also seeks views on Government proposals to allow the safe use of this system on British roads at speeds of up to 70mph, where technology allows.
Transport Minister Rachel Maclean said: “Automated technology could make driving safer, smoother and easier for motorists and the UK should be the first country to see these benefits, attracting manufacturers to develop and test new technologies.
“The UK’s work in this area is world leading and the results from this Call for Evidence could be a significant step forward for this exciting technology.”
Following the approval of ALKS Regulation in June 2020 by the United Nations Economic Commission for Europe (UNECE) – of which the UK is a member – the technology is likely to be available in cars entering the UK market from Spring 2021.
The Government is acting now to ensure that regulation is ready where necessary for its introduction.
Edmund King, AA president, added: “Over the last fifty years leading edge in-car technology from seat belts to airbags and ABS has helped to save thousands of lives.
“The Government is right to be consulting on the latest collision-avoidance system which has the potential to make our roads even safer in the future.”
Mike Hawes, SMMT chief executive, said: “Automated technologies for vehicles, of which automated lane keeping is the latest, will be life-changing, making our journeys safer and smoother than ever before and helping prevent some 47,000 serious accidents and save 3,900 lives over the next decade.
“This advanced technology is ready for roll out in new models from as early as 2021, so today’s announcement is a welcome step in preparing the UK for its use, so we can be among the first to grasp the benefits of this road safety revolution.”
In late 2020, the Government plans to launch a public consultation on the detail of any changes to legislation and the Highway Code that are proposed, which will include a summary of responses to this Call for Evidence. By Graham Hill thanks to Fleet News
Share My Blogs With Others:These icons link to social bookmarking sites where readers can share and discover new web pages.
The Chancellor’s summer economic plan introduced a range of measures to help the UK economy recover from the impact of the coronavirus.
The plan, revealed to the House of Commons yesterday (Wednesday, July 8), to protect jobs, help younger workers and encourage spending with measures such as a temporary VAT cut, from 20% to 5%, for the hospitality sector and a restaurant voucher scheme.
However, help for the fleet industry and wider automotive sector, including a potential scrappage scheme, was not forthcoming.
Paul Hollick, chairman of fleet representative body the Association of Fleet Professionals (AFP), said: “The Chancellor’s announcement was all about carefully targeted help for various sectors that are felt to be among the most vulnerable and it is disappointing that none of this support has found its way into areas that are likely to benefit fleets.
“This especially applies to low-carbon transport initiatives but there could also have potentially been aid for dealers, manufacturers and even fleet service support companies, all of which are facing specific problems.
“Given the fast-moving economic and infection situation, we don’t think this is the last time we’ll see him making announcements of this type over the next few months and we remain hopeful that we will be included in future programmes, an argument we’ll be making as an organisation.”
The automotive sector had been hoping for a scrappage scheme, offering money off a new car purchase.
Mike Hawes, chief executive at the Society of Motor Manufacturers and Traders (SMMT), welcomed the Chancellor’s plans to safeguard jobs and encourage consumer spending in some parts of the economy.
However, he said: “It’s bitterly disappointing the Chancellor has stopped short of supporting the restart of one of the UK’s most important employers and a driver of growth.
“The automotive sector has been particularly hard hit, with thousands of job losses already announced and many more at risk.
“Of Europe’s five biggest economies, Britain now stands alone in failing to provide any dedicated support for its automotive industry, a situation that will only deter future investment.
“We urgently need government to expand its strategy and introduce sector-specific measures for UK auto to support cash flow such as business rate holidays, tax cuts, and policies that provide broader support for consumer confidence and boost the big ticket spending that drives manufacturing. Until critical industries such as automotive recover, the UK economic recovery will be stuck in low gear.”
The Chancellor instead offered a ‘job retention bonus’ to encourage firms to retain furloughed staff. The one-off £1,000 payment will be made to employers for every furloughed employee retained to the end of January 2021.
It applies to workers earning over £520 per month, with the cost estimated at up to £9.4 billion.
There is a six-month VAT cut for restaurants, hotels and attractions, from 20% to 5% from July 15 to January 12, 2021.
Food and non-alcoholic drinks in restaurants, pubs and cafes, as well as hot takeaway food will be covered. Accommodation in hotels and B&Bs and admission to attractions such as theme parks and cinemas also affected
The threshold for stamp duty on residential property in England and Northern Ireland will also rise from £125,000 to £500,000. It applies from July 8 until March 31, 2021.
Energy efficiency grants for homes have also been introduced.
In addition, a ‘Eat Out to Help Out’ scheme offers 50% discount for every diner, up to £10 a head, from Monday to Wednesday throughout August.
Support for young workers is to be delivered through the ‘Kickstart scheme’ – a £2bn fund to pay for six-month work placements for 16 to 24-year-olds on universal credit – and grants for training young people.
In terms of infrastructure, more is expected in the Budget, while the Prime Minister, Boris Johnson, has earmarked £100 million for 29 road projects.
Nick Molho, executive director of the Aldersgate Group, said: “Beyond the need to commit public investment to support shovel ready projects and early stage innovation trials, it is critical that the Government puts forward a comprehensive policy plan in the autumn to drive private sector investment towards the low carbon and environmentally resilient infrastructure needed to put the UK on track for its net zero and nature restoration targets.
“Clear policy commitments in areas such as energy efficiency, clean transport and industrial decarbonisation will be vital if the private sector is to do a lot of the heavy lifting to build a competitive, jobs rich, low carbon economy.” By Graham Hill thanks to Fleet News
Share My Blogs With Others:These icons link to social bookmarking sites where readers can share and discover new web pages.
Used car values for both petrol and diesel stayed strong in August, but used electric vehicles (EVs) and some hybrids continue to struggle, says Cap HPI.
For the third month in a row, values for EVs have reduced, it reports, with feedback from the market suggesting that EVs continue to look expensive compared to their internal combustion engine equivalents.
For the volume models, price pressure continues to be around the three-year-old EVs, which are coming back into the market, says Cap HPI.
Derren Martin, head of valuations UK at Cap HPI, explained: “2017 saw an increase of around 40% in EV new car registrations over the previous year, so it is no surprise that as more vehicles come back into the used market, values will be exposed to supply and demand dynamics.
“Some examples of models that have dropped in value at that age are the BMW i3, Kia Soul and Nissan Leaf.”
Some hybrids that have moved down in value at the three-year point are the Toyota Auris, Toyota Prius, Lexus LS and Mercedes-Benz S-Class. Some of this is due to a reduction in activity in the private hire industry, where demand for these vehicles has historically been strong.
Overall, pricing experts at Cap HPI say that the used car market remains strong in August, with values up by a minimal 0.2% at the three-year point, which equates to around £30 on average.
So far this year, there has only been one month where values dropped and that was during the run-up to lockdown in March.
On average, used car values when calculating the same models at the same age and mileage point as a year ago, are some 7% higher than they were in August 2019.
Martin said: “The used car retail market has remained robust throughout August, making it the third consecutive month since car showrooms reopened with remarkably strong consumer demand.#
“Looking at the retail advertised data received by Cap HPI, it is clear that across all mainstream sectors, prices have edged up slightly on average. This is unsurprising since trade prices have increased overall and consumer demand is so strong.
“If ever there was a time to increase asking prices and maintain margins, the last three months has been it. These small average increases have not adversely affected days-to-sell.”
Martin says that consumer demand is still being driven by people wanting to avoid public transport, buyers downgrading and savers looking to upgrade.
The SUV sector saw smaller models increase in price, while larger ones were under more pressure due to significant availability, meaning prices dropped slightly.
The trend was most acute at younger ages, and at six-months-old, larger SUVs have fallen by around £225 on average, whereas smaller examples have increased by around £150.
The Citroen C4 Cactus, Dacia Duster and Renault Captur have increased in value the most of these smaller models. There is generally a very different customer for these two sizes of SUV.
Martin concluded: “Since the unexpected upturn in June, particularly at older ages, Live values during July and August have stayed very stable, as we predicted.
“September will result in more part-exchanges and fleet returns hitting the market, as new car buyers opt for the 70-plate, but it is unlikely that volumes will be as high as in previous years.”
He continued: “The reduced volumes of cars would typically lead to strong prices. However, with the furlough scheme coming to a close and an economic downturn continuing, consumers are likely to become more prudent.
“The pent-up demand from inactivity during lockdown will come to an end, as will people buying to avoid public transport – that was always likely to be a short-term dynamic. Those upsizing due to grants or savings made during the last few months will also wane.
“In short, predictions are that the next few weeks will remain stable, as there is currently no weakness in the market. However, from the end of September and into October, prices are likely to come under more pressure. What is clear is that viewing valuations in real-time and keeping vigilant will become more important than ever.” By Graham Hill thanks to Fleet News.
Share My Blogs With Others:These icons link to social bookmarking sites where readers can share and discover new web pages.
A review by Her Majesty’s Inspectorate of Constabulary and Fire & Rescue Services (HMICFRS) has cast doubt on whether police forces are doing enough to monitor and improve road safety.
The Department of Transport (DfT) have estimated that the national cost of all road traffic collisions is £36 billion per annum.
Since 1979, whilst the numbers killed in road accidents in England and Wales had been reducing, there have been recent increases.
In 2013 the number of deaths was 1541, but this had increased to 1624 by 2018, with an additional 23,931 serious accidents where often life changing injuries were suffered.
It is accepted that one effective measure for maintaining road safety is the placement of speed enforcement cameras.
Whilst some police forces have adopted parts of the national roads policing strategy, some were unable to provide any evidence a strategy was in place to reduce deaths and serious collisions on roads.
Most forces were unable to demonstrate that placement of cameras was based on consideration of the causes of serious collisions on roads in their area.
Whilst police forces do not receive funds from fines and fixed penalties, they can recover costs for administration and provision of educational schemes.
Deployment of speed cameras is mainly carried out by road safety partnerships.
The report found that this has resulted in safety partnerships preventing use of fixed cameras in areas where the safety partnership has deployed mobile speed enforcement cameras.
Not surprisingly, this has raised suspicion with police officers that the focus of activity for use of speed enforcement cameras was influenced more by increasing revenue than by reducing serious accidents in areas where a higher incidence of collisions was found to exist.
It should be noted, the number of dedicated road policing officers has decreased.
Spending on road policing has fallen by 34% in England and Wales from 2012/13 to 2019/20.
This has been found to have resulted in enforcement action lacking focus and appropriate evaluation of outcomes.
The report makes a number of recommendations and encourages police forces to share best practice on analysis of vulnerable road users, repeat offenders, or the causes of collisions.
It was also recommended that roads policing training should be standardised and accredited.
The report noted that whilst motorcyclists make up only 0.8% of traffic, they make up 26% of those killed or seriously injured.
With a likely significant increase in the number of cyclists using the road network, given one of the impacts of the Covid-19 pandemic, it is more important than ever that road safety is given a high priority by police forces and road safety partnerships. By Graham Hill thanks to Fleet News
Share My Blogs With Others:These icons link to social bookmarking sites where readers can share and discover new web pages.
Local authorities in London and Cardiff have raised £58.2 million from drivers committing moving traffic offences in just one year, with the same powers due to be rolled out to other councils.
Moving traffic offences include stopping on a yellow box junction, making an illegal turn or driving down a ‘no entry’ road.
The only local authorities that currently have the power to enforce these offences in England and Wales are London boroughs and Cardiff Council.
Figures obtained via a Freedom of Information request suggest they collected £58.2m in penalty charge notices (PCNs) in 2018/19 – 25% (£11.5m) more than in 2016/17 (£46.7m).
Currently, local authorities outside of London and Cardiff only have powers to enforce bus lane contraventions.
RAC head of roads policy, Nicholas Lyes, said: “It’s plain for all to see that London boroughs, TfL and Cardiff are generating phenomenal sums of money from the enforcement of moving traffic offences.”
In 2016/17, councils issued 752,871 PCNs, rising to 1,007,405 in 2018/19 which equates to a 34% rise.
Yellow box junctions were the biggest revenue generator, bringing in £31.4m in 2018/19 compared to £22.3m for ‘no turn’ offences and £4.4m for ‘no entry’ contraventions.
Looking at Cardiff alone, nearly four times as many PCNs were issued in 2018/19 compared to 2016/17 (74,142 compared to 19,080) translating to a £1.8m hike in revenue (£593,160 to £2.4m – 313%).
The most profitable offences for Cardiff are ‘no turns’ yielding £1.4m in contrast to £826,424 for yellow box junctions and £182,782 for ‘no entry’ offences.
Of the London boroughs which provided data to the RAC a total of 933,263 PCNs were issued in 2018/19, 27% more than two years ago (733,791). This, however, only translated to a 21% increase in revenues (£46.1m to £55.7m).
Yellow box junctions
Of the authorities which benefitted the most from the enforcement of yellow box junctions, Transport for London (TfL) topped the table with a revenue of nearly £10m (£9,969,545 – 135,923 PCNs) in 2018/19.
But in terms of single councils, Hammersmith and Fulham came out top with a £3.5m yellow box revenue pot (from 53,576 PCNs) generated from 16 enforced junctions out of 23 in its area – £1.1m ahead of its nearest rival Redbridge on £2.4m (34,782 PCNs from 14 enforced junctions out of a total of 35).
Merton, the only other council to pocket more than £2m in yellow box penalties, was third on £2.2m (31,081 PCNs from 27 enforced junctions, no overall total of junctions available).
In terms of average revenues per enforced junction, Westminster recorded the highest figure with a single junction generating £333,295 from 4,595 PCNs.
Hammersmith and Fulham had the second largest average on £223,472 (£3.5m from 16 enforced junctions) and Richmond had the second largest average revenue with £156,117.
TfL has 399 yellow box junctions but declined to disclose how many are enforced.
No turn offences
Three authorities topped £2m in revenue from ‘no turn’ offences with Ealing even managing to outdo TfL with a revenue of £2.6m (from 44,612 PCNs) versus £2m (£2,093,651, from 28,978 PCNs). Hackney had the third highest total on £1,888,845.
No entry offences
Harrow was top for ‘no entry’ offences with a revenue of £549,785 followed by Southwark on £420,760 and Islington on £357,265.
Lyes said: “The vast majority of drivers we’ve surveyed agree that those who stop on yellow boxes, make illegal turns or go through ‘no entry’ signs need to be penalised, but when it comes to extending powers to other councils many are concerned, with 68% thinking local authorities will rush to install cameras to generate additional revenue.
“Four in 10 drivers (39%) also believe that road layouts and signage will be made deliberately confusing to increase the number of PCNs issued.
“Clearly, the priority for enforcement should be to improve road safety and reduce congestion.”
The DfT’s decision to extend the same enforcement powers to other local authorities, however, Lyes believes should come with guidance setting out where enforcement should be targeted and the types of signs that must be used to make drivers aware that enforcement cameras are operating, and for what type of moving traffic offence.
“It should also make clear the circumstances in which a PCN can be appealed and where mitigating circumstances may apply such as stopping in a yellow box to allow an emergency services vehicle to go by,” continued Lyes.
“We welcome proposals that first offenders are sent a warning letter before subsequent penalties apply. This is particularly important where changes are made to urban road layouts. What we do not want is this being seen by cash-strapped local authorities as a way to generate revenue.
“In addition, we would urge local authorities to publish annual reports of moving traffic offence receipts by type and by junction.
“We would also encourage them to monitor hot spots where an unusually high proportion of PCNs are issued as this is more than likely a clear indication of a problem with signage or road layout.”
Tables
Key: NA – Not available; DNE – Does not enforce; DNR – Did not respond
Summary – all authorities in England and Wales with power to enforce moving traffic offences
All – London boroughs & Cardiff
PCNs – 16/17
PCNs 17/18
PCNs 18/19
Revenues 16/17
Revenues 17/18
Revenues 18/19
Box junctions
404,618
455,129
510,065
£25,893,253
£28,943,627
£31,410,486
No turns
290,094
384,356
419,801
£17,119,308
£21,908,787
£22,377,326
No entry
58,159
62,490
77,539
£3,725,794
£3,563,781
£4,453,518
Total
752,871
901,975
1,007,405
£46,738,355
£54,416,195
£58,241,330
Change – year-on-year
149,104
105,430
£7,677,840
£3,825,135
+12%
+7%
Change 16/17 to 18/19
254,534
£11,502,975
+34%
+25%
Cardiff
PCNs – 16/17
PCNs 17/18
PCNs 18/19
Revenues 16/17
Revenues 17/18
Revenues 18/19
Box junctions
4,163
8,165
23,752
£150,876
£296,030
£826,424
No turns
14,917
42,862
44,747
£442,284
£1,388,241
£1,438,732
No entry
0
4,474
5,643
£0
£160,292
£182,782
Total
19,080
55,501
74,142
£593,160
£1,844,563
£2,447,938
Change – year-on-year
36,421
18,641
£1,251,403
£603,375
+34%
+33%
Change 16/17 to 18/19
55,062
£1,854,778
+289%
+313%
London boroughs
PCNs – 16/17
PCNs 17/18
PCNs 18/19
Revenues 16/17
Revenues 17/18
Revenues 18/19
Box junctions
400,455
446,964
486,313
£25,742,377
£28,647,597
£30,584,062
No turns
275,177
341,494
375,054
£16,677,024
£20,520,546
£20,938,594
No entry
58,159
58,016
71,896
£3,725,794
£3,403,489
£4,270,736
Total
733,791
846,474
933,263
£46,145,195
£52,571,632
£55,793,392
Change – year-on-year
112,683
86,789
£6,426,437
£3,221,760
+10%
+6%
Change 16/17 to 18/19
199,472
£9,648,197
+27%
+21%
Box junctions PCNs ranked by 18/19
Rank
Council / Authority
PCNs – 16/17
PCNs 17/18
PCNs 18/19
1
Transport for London
108,151
122,991
135,923
2
Hammersmith and Fulham
65,367
64,316
53,576
3
Barnet
28,530
40,399
38,860
4
Waltham Forest
34,472
23,851
35,423
5
Redbridge
11,723
27,937
34,782
6
Merton
32,589
39,679
31,081
7
Cardiff
4,163
8,165
23,752
8
Brent
12,600
18,032
20,207
9
Islington
2,423
9,392
15,343
10
Wandsworth
1,440
5,517
15,321
11
Richmond
2,995
4,526
15,238
12
Barking & Dagenham
5,219
4,461
12,903
13
Enfield
16,903
10,958
11,018
14
Kingston upon Thames
17,245
15,665
9,654
15
Bexley
11,416
9,079
9,609
16
Ealing
7,126
9,229
9,565
17
Haringey
10,036
13,380
9,205
18
Camden
6,957
5,889
7,407
19
Hounslow
13,442
8,077
7,051
20
Lambeth
1,077
1,927
5,230
21
Westminster
6,946
6,416
4,595
22
Hackney
11
3,217
2,609
23
Harrow
1,835
1,220
1,161
24
Southwark
1,208
804
552
25
City of London
744
2
0
Sutton
0
0
0
Croydon
DNR
DNR
DNR
Newham
DNR
DNR
DNR
Bromley
DNE
DNE
DNE
Greenwich
DNE
DNE
DNE
Havering
DNE
DNE
DNE
Hillingdon
DNE
DNE
DNE
Kensington and Chelsea
DNE
DNE
DNE
Lewisham
DNE
DNE
DNE
Tower Hamlets
DNE
DNE
DNE
TOTAL
404,618
455,129
510,065
Change – year-on-year
50,511
54,936
Change 16/17 to 18/19
105,447
Box junctions revenue ranked by 18/19
Rank
Council / Authority
Revenues 16/17
Revenues 17/18
Revenues 18/19
Number of Box junctions
Numbers currently enforced
Numbers enforced in 18/19
1
Transport for London
£7,622,149
£8,895,998
£9,969,545
399
NA
NA
2
Hammersmith and Fulham
£4,572,143
£4,518,388
£3,575,565
23
16
16
3
Redbridge
£833,095
£1,933,623
£2,463,172
35
18
14
4
Merton
£2,366,302
£2,885,817
£2,253,219
NA
23
27
5
Waltham Forest
£2,337,874
£1,587,932
£1,880,431
27
17
17
6
Brent
£864,875
£1,238,439
£1,241,202
116
59
59
7
Richmond
£156,978
£549,265
£1,092,821
14
7
10
8
Wandsworth
£87,065
£373,946
£982,139
22
11
11
9
Islington
£150,343
£607,728
£979,817
40
37
37
10
Barking & Dagenham
£337,624
£315,083
£917,360
NA
13
13
11
Cardiff
£150,876
£296,030
£826,424
N/A
12
11
12
Kingston upon Thames
£1,119,590
£977,429
£719,618
28
8
5
13
Enfield
£1,063,083
£692,022
£688,123
43
6
6
14
Bexley
£780,377
£606,236
£649,193
11
7
7
15
Haringey
£696,022
£893,305
£606,541
45
23
23
16
Ealing
£496,960
£611,529
£568,492
NA
9
NA
17
Camden
£472,327
£416,741
£543,354
55
6
6
18
Hounslow
£973,161
£576,374
£466,654
NA
NA
26
19
Lambeth
£73,550
£125,003
£356,874
NA
4
8
20
Westminster
£483,011
£475,462
£333,295
NA
1
1
21
Hackney
£195
£229,951
£179,421
23
1
2
22
Harrow
£127,994.93
£81,641.27
£77,154.11
18
5
8
23
Southwark
£84,230
£55,554
£40,073
36
4
4
24
City of London
£43,429
£130
£0
5
0
0
Sutton
£0
£0
£0
5
1
0
Barnet
NA
NA
NA
22
17
17
TOTAL
£25,893,253
£28,943,627
£31,410,486
945
288
311
Change – year-on-year
£3,050,374
£2,466,859
Change 16/17 to 18/19
£5,517,233
‘No turn’ PCNs ranked by 18/19
Rank
Council / Authority
PCNs – 16/17
PCNs 17/18
PCNs 18/19
1
Barnet
21,558
36,745
53,297
2
Cardiff
14,917
42,862
44,747
3
Ealing
43,985
41,716
44,612
4
Hackney
0
2,194
31,327
5
Waltham Forest
23,222
25,757
29,052
6
Havering
4,486
26,080
29,012
7
Transport for London
14,117
26,539
28,978
8
Harrow
15,801
19,062
17,596
9
Brent
30,630
23,171
16,773
10
Westminster
2,264
16,546
16,391
11
Merton
18,454
21,259
15,577
12
Wandsworth
3,125
4,692
11,786
13
Tower Hamlets
1,042
6,612
9,611
14
Barking & Dagenham
7,514
9,294
9,161
15
Islington
9,272
9,634
8,930
16
Haringey
13,337
12,718
8,319
17
Southwark
10,515
9,045
7,297
18
Enfield
7,683
10,281
7,061
19
Camden
9,622
8,409
6,470
20
Hammersmith and Fulham
11,315
10,382
6,180
21
Kingston upon Thames
12,683
6,419
5,932
22
Lewisham
0
2,914
4,648
23
Lambeth
6,601
4,579
3,760
24
Redbridge
4,272
2,463
1,258
25
Hounslow
417
299
954
26
Richmond
2,995
4,526
846
27
Bexley
267
158
172
28
Hillingdon
0
0
54
City of London
NA
NA
NA
Sutton
NA
NA
NA
Bromley
DNE
DNE
DNE
Greenwich
DNE
DNE
DNE
Kensington and Chelsea
DNE
DNE
DNE
Croydon
DNR
DNR
DNR
Newham
DNR
DNR
DNR
TOTAL
290,094
384,356
419,801
Change – year-on-year
94,262
35,445
Change 16/17 to 18/19
129,707
‘No turn’ revenue – ranked by 18/19
Rank
Council
Revenues 16/17
Revenues 17/18
Revenues 18/19
1
Ealing
£2,683,701
£2,656,095
£2,685,346
2
Transport for London
£1,012,411
£1,903,322
£2,093,651
3
Hackney
£0
£133,420
£1,888,845
4
Havering
£459,856
£1,698,206
£1,872,821
5
Waltham Forest
£1,526,667
£1,688,329
£1,865,539
6
Cardiff
£442,284
£1,388,241
£1,438,732
7
Brent
£1,969,815
£1,756,762
£1,317,666
8
Westminster
£88,507
£1,195,813
£1,177,011
9
Merton
£1,322,351
£1,548,912
£1,132,455
10
Harrow
£1,044,236
£1,245,682
£1,096,385
11
Wandsworth
£175,279
£302,830
£718,888
12
Barking & Dagenham
£472,662
£631,866
£620,809
13
Tower Hamlets
£4,616
£395,168
£569,120
14
Haringey
£921,276
£853,553
£535,393
15
Islington
£553,306
£554,082
£495,051
16
Southwark
£706,394
£607,718
£463,048
17
Camden
£633,714
£578,576
£445,899
18
Enfield
£484,953
£656,839
£421,395
19
Kingston upon Thames
£805,522
£369,325
£399,809
20
Hammersmith and Fulham
£771,727
£710,464
£399,250
21
Lewisham
£0
£180,653
£263,818
22
Lambeth
£438,396
£315,769
£246,080
23
Redbridge
£287,682
£155,448
£81,444
24
Richmond
£214,526
£310,580
£61,407
25
Hounslow
£28,767
£19,388
£52,803
26
City of London
£53,942
£41,543
£20,215
27
Bexley
£16,719
£10,204
£11,034
28
Hillingdon
£0
£0
£3,412
Sutton
£0
£0
£0
Bromley
DNE
DNE
DNE
Greenwich
DNE
DNE
DNE
Kensington and Chelsea
DNE
DNE
DNE
Barnet
DNR
DNR
DNR
Croydon
DNR
DNR
DNR
Newham
DNR
DNR
DNR
TOTAL
£17,119,308
£21,908,787
£22,377,326
Change – year-on-year
£4,789,479
£468,538
Change 16/17 to 18/19
£5,258,018
No entry PCNs ranked by 18/19
Rank
Council / Authority
PCNs – 16/17
PCNs 17/18
PCNs 18/19
1
Harrow
2,209
3,223
8,286
2
Southwark
5,213
5,309
7,000
3
Islington
6,954
5,210
6,845
4
Haringey
7,379
6,049
5,825
5
Cardiff
0
4,474
5,643
6
Hackney
471
1,979
5,099
7
Lewisham
3,396
3,760
5,092
8
Enfield
3,665
5,029
4,086
9
Merton
172
39
3,673
10
Barnet
838
4,072
3,640
11
Waltham Forest
1,030
3,324
3,103
12
Hillingdon
0
0
2,974
13
Sutton
0
556
2,830
14
Camden
3,647
2,475
2,116
15
Kingston upon Thames
17,379
5,505
2,086
16
Redbridge
0
181
1,826
17
Lambeth
1,216
1,185
1,442
18
Hounslow
129
4,177
1,355
19
Tower Hamlets
116
646
1,326
20
Ealing
715
947
1,197
21
Westminster
NA
1,353
1,023
22
Barking & Dagenham
392
660
339
23
Transport for London
2,717
989
339
24
Bexley
145
191
204
25
Havering
227
949
113
26
Brent
127
201
75
27
Wandsworth
22
7
2
City of London
NA
NA
NA
Hammersmith and Fulham
NA
NA
NA
Bromley
DNE
DNE
DNE
Greenwich
DNE
DNE
DNE
Kensington and Chelsea
DNE
DNE
DNE
Richmond
DNE
DNE
DNE
Croydon
DNR
DNR
DNR
Newham
DNR
DNR
DNR
TOTAL
58,159
62,490
77,539
Change – year-on-year
4,331
15,049
Change 16/17 to 18/19
19,380
‘No entry’ revenue ranked by 18/19
Rank
Council / Authority
Revenues 16/17
Revenues 17/18
Revenues 18/19
1
Harrow
£145,187
£209,595
£549,785
2
Southwark
£346,670
£343,540
£420,760
3
Islington
£393,285
£300,862
£357,265
4
Haringey
£453,605
£365,735
£339,607
5
Hackney
£27,468
£121,885
£307,539
6
Lewisham
£203,876
£217,105
£288,870
7
Merton
£12,287
£2,738
£243,063
8
Hillingdon
£0
£0
£198,979
9
Sutton
£0
£24,127
£190,571
10
Waltham Forest
£67,943
£210,741
£189,606
11
Cardiff
£0
£160,292
£182,782
12
Enfield
£197,406
£232,101
£179,249
13
Kingston upon Thames
£890,944
£308,018
£145,360
14
City of London
£434,750
£246,878
£145,180
15
Camden
£187,193
£153,129
£142,585
16
Redbridge
£0
£12,560
£115,166
17
Hounslow
£8,933
£223,070
£89,933
18
Tower Hamlets
£649
£39,489
£89,318
19
Lambeth
£79,154
£75,269
£87,269
20
Westminster
NA
£89,178
£73,395
21
Ealing
£29,972
£44,714
£49,843
22
Transport for London
£186,964
£70,586
£23,409
23
Barking & Dagenham
£20,996
£31,541
£17,980
24
Bexley
£9,253
£13,373
£12,512
25
Havering
£21,067
£51,291
£7,073
26
Brent
£6,826
£15,574
£6,353
27
Wandsworth
£1,365
£390
£65
Hammersmith and Fulham
NA
NA
NA
Barnet
NA
NA
NA
Bromley
NA
NA
NA
Greenwich
DNE
DNE
DNE
Kensington and Chelsea
DNE
DNE
DNE
Richmond
DNE
DNE
DNE
Croydon
DNR
DNR
DNR
Newham
DNR
DNR
DNR
TOTAL
£3,725,794
£3,563,781
£4,453,518
Change – YOY
-£162,013
£889,737
Change 16/17 to 18/19
£727,724
By Graham Hill thanks to Fleet News
Share My Blogs With Others:These icons link to social bookmarking sites where readers can share and discover new web pages.
Driver offender rehabilitation courses, such as the Speed Awareness Course, may be permanently held online, following successful delivery during the coronavirus lockdown.
TTC Group, the UK’s largest provider of UK Road Offender Education (UKROEd) accredited courses, says support for virtual courses continues to gain traction from all stakeholders.
The benefits of holding courses online include; availability, time saved and reduced travel requirements.
Virtual classrooms have also given rise to specific benefits for special populations – individuals overseas, those in rural areas and, more specifically, TTC Group hosted a course dedicated to the hard of hearing.
Sharon Haynes, TTC Group’s client services director, said: “It’s all about making a positive difference, whether that is by creating safer motorists or by addressing key social issues in the areas we operate in.
“Online or in person these rehabilitation programmes can have a positive, life changing influence on people and it is so important to offer as many people as possible convenient access to them.
“The move to virtual classrooms continues to prove a major success and we look forward to understanding more of the impact of this in the near future.”
During the pandemic, TTC Group switched to virtual courses and transferred all pre-booked ‘physical’ National Driver Offender Retraining Scheme course attendees to a digital solution.
Haynes added: “This really did change the face of the driver offender rehabilitation programme and acts as a great template to consider what we can do in association with UKROEd moving ahead to benefit all key stakeholders from individual drivers, police forces, other road users and employers alike.
“However, there is still much work to be done behind the scenes and we are working alongside UKROEd to ensure the emerging benefits are supported by key data insights.”
Courses currently available in digital classroom format include: National Speed Awareness Course; National Motorway Awareness; Safe and Considerate Driving; and What’s Driving Us?
Lockdown speeding increase
Easy access to courses remains key while social distancing measures are in place across the UK, with demand remaining strong as speeding and other motoring offences continue to rise.
Motorists were speeding three times more frequently during lockdown compared to normal, according to analysis by telematics firm AX.
It found serious speeding events – the most severe category of excessive speed – occurred every 136 miles on average in April, compared to every 443 miles in February.
Major speeding events were also significantly more frequent, taking place on average once every 32 miles in April, down from every 94 miles in February.
It wasn’t just a case of motorists covering shorter journeys either, with major speeding events occurring on average once every 4.3 trips in April compared to every 9.8 trips two months earlier.
Van drivers proved to be much more obedient than car drivers, with telematics devices detecting major incidents twice as often as normal compared to four times as frequently for car drivers.
Director of Investigative Services at AX, Neil Thomas, said: “It’s fascinating to see how driver behaviour has been influenced by the impacts of COVID-19.
“Whether it was simply down to reduced traffic levels during lockdown or perhaps drivers assuming police forces had bigger priorities, the data shows that given the opportunity, many drivers are clearly willing to speed and quite often significantly so.” By Graham Hill thanks to Fleet News
Share My Blogs With Others:These icons link to social bookmarking sites where readers can share and discover new web pages.